Sydney, NSW Australia

Visitor Forecasting
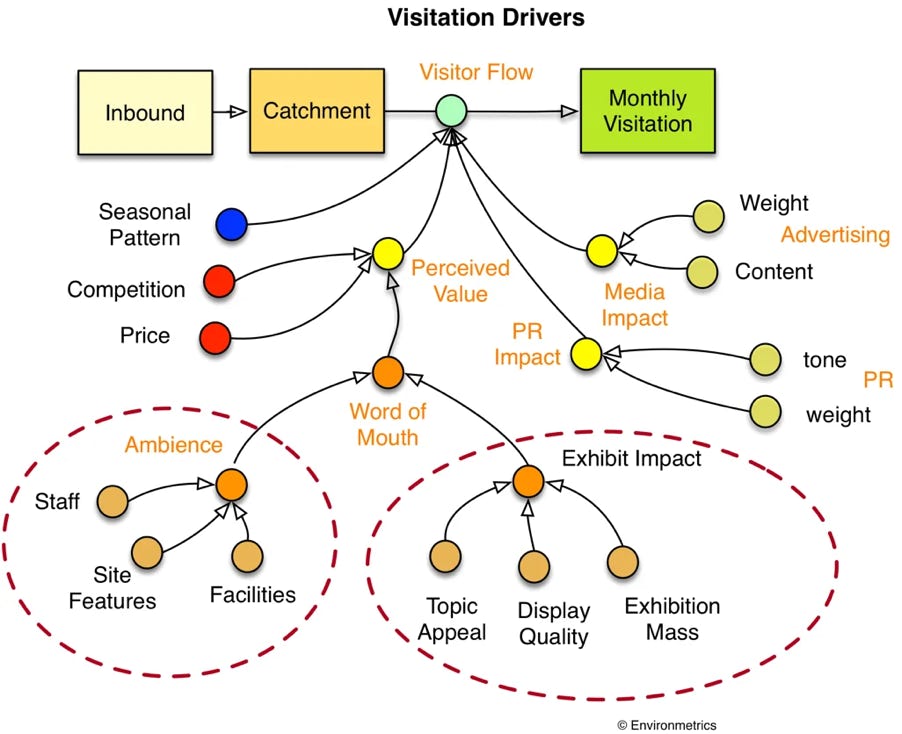
An example of the block diagram for a dynamic simulation model I use for forecasting.
The input variables are added to a Monte Carlo model to allow for variability in values.
The “Catchment” is a set of geographic catchments. A primary catchment is one from which people can reach a venue easily for “a morning or afternoon out”. A secondary catchment requires “a day out”.
Unfortunately, forecasting the likely number of visitors to a place is often mishandled. One of the most common errors is to confuse “visits” (clicks on the turnstile”) with “visitors” (the people who are carrying the wallets). A venue can have the same number of “clicks” by a small number of people coming repeatedly or a large number of people coming once. (More errors are described in the PDF available below).
We find it helpful to create dynamic systems models and use these to simulate the competitive environment in which a venue operates.
The “Seasonal Pattern” includes the characteristic frequency with which people in the Catchment visit a venue or place in a year. For example, visitors to a major art gallery tend to visit the gallery more frequently than visitors to a major museum visit the museum.
The article available here describes some of the mistaken assumptions researchers make in forecasting visitor numbers.

Click on the PDF image to read the document